Carbon data for the land use sector.


Continuous data records since 2000 give reporting teams the historical foundation that auditors, regulators, and verification bodies require.

Chloris uses satellite-derived data to track above-ground biomass carbon over time, rather than inferring emissions using default emission factors.

Wall-to-wall satellite coverage enables above-ground biomass estimation across sourcing regions, jurisdictions, and supplier footprints, with historical data available from 2000. Land-use change emissions and removals can be assessed with substantially less reliance on field data than traditional approaches.

Chloris data is structured to support GHG Protocol LSRS requirements, with relevant carbon pools, uncertainty information, and a traceable audit trail built in. The data can also be adapted to support other relevant reporting standards and frameworks.
Chloris delivers the carbon data you need to meet reporting requirements with confidence.
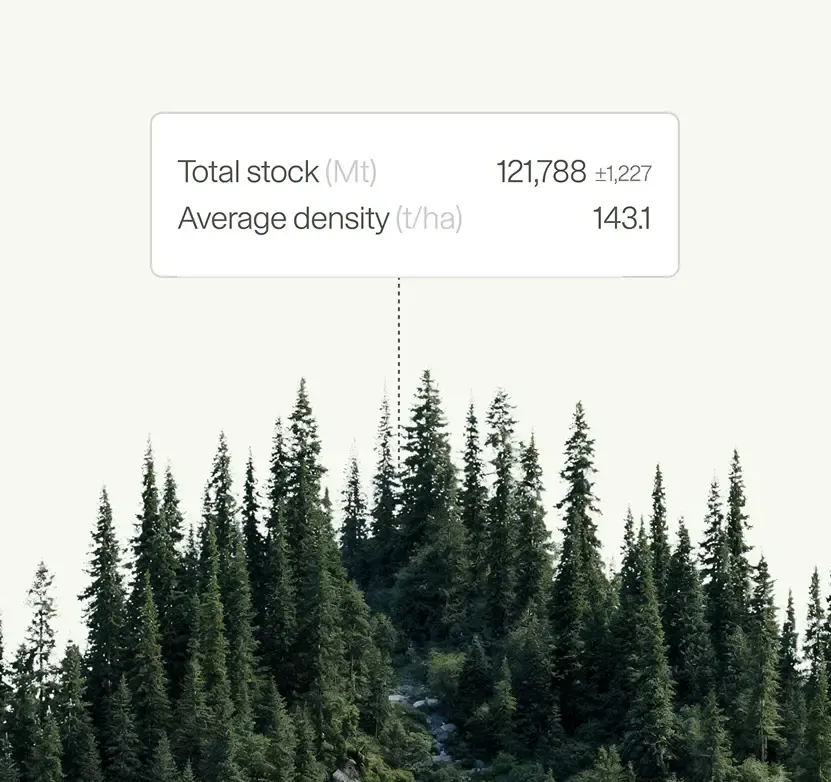
Quantify land use change emissions at farm, mill, province, or jurisdiction level, in line with the GHG Protocol LSRS and other relevant standards.
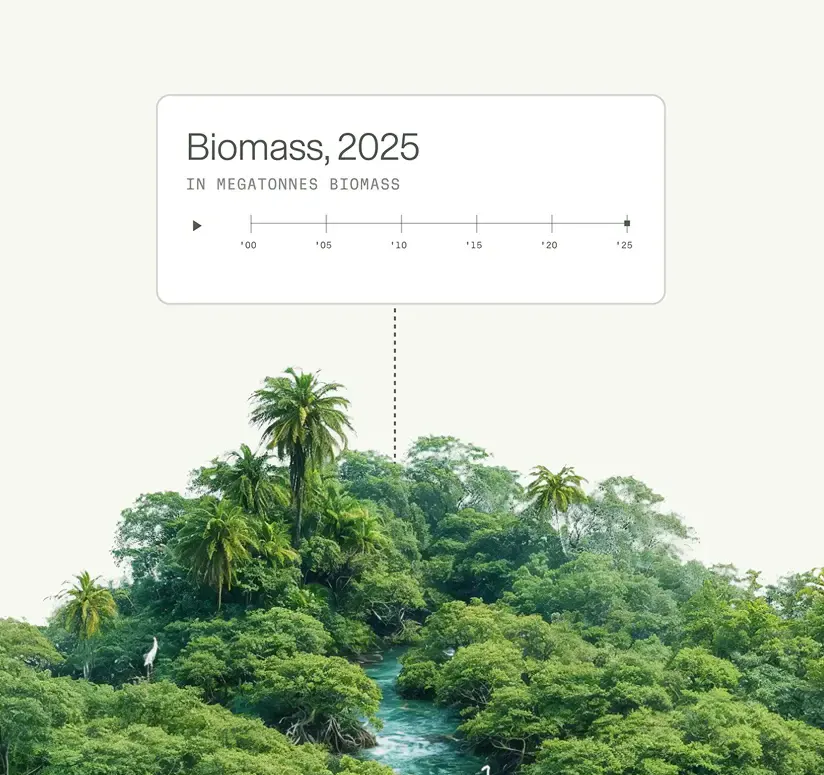
Measure biomass growth from reforestation, agroforestry, and improved land management to support credible insetting claims under the GHG Protocol LSRS.
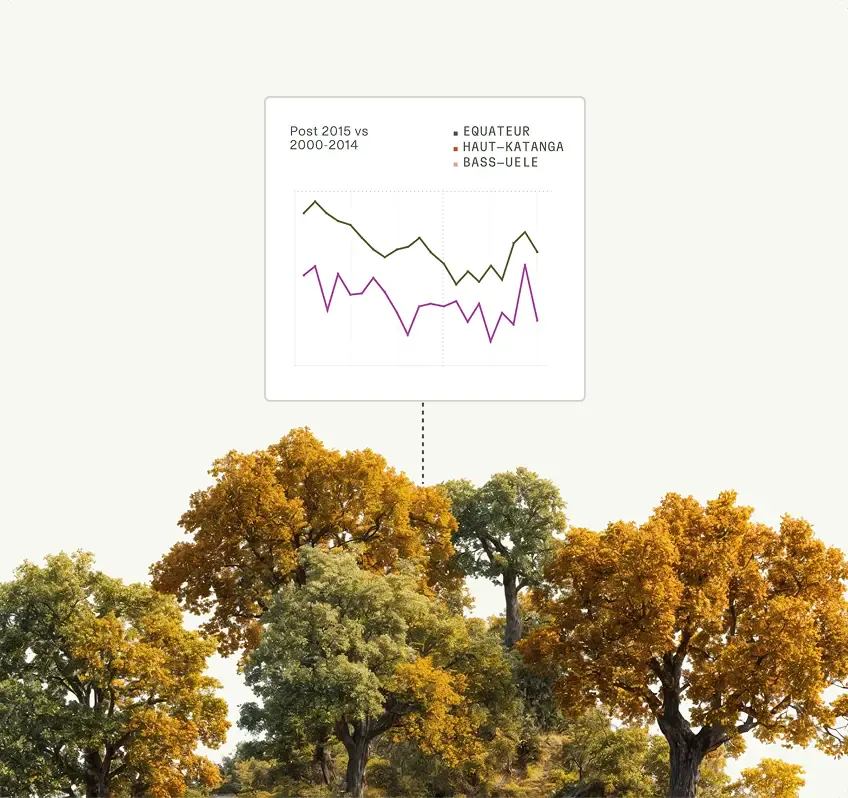
Documented, repeatable, and verifiable measurements with a 95% confidence interval and transparent audit trail, built to withstand third-party verification.


Under the GHG Protocol's Land Sector and Removals (LSR) Standard, any company with significant land-based operations or value-chain exposure must now report emissions from land use change (LUC): the carbon released when forest, grassland, or wetland is converted to grow a commodity.
For palm oil, LUC of forest and peatland is often the single largest contributor to the cradle-to-gate footprint when recent conversion is in scope, and the size of that contribution turns on the pre-conversion carbon stock assigned to the cleared land.
In practice that stock is rarely measured on site; companies apply a single reference value across forests whose real carbon density varies widely. How that value is derived depends on the accounting pathway.
Science-grade biomass data, calibrated and configured for your sourcing footprint, with expert support at every step.

Tailored datasets aligned to your project or portfolio, calibrated with local reference data.

Calibration validated against your reporting and compliance requirements, with expert support throughout.

Custom analysis, built on calibrated baselines, to support decision-making.

Ongoing partnership as your footprint and needs evolve.
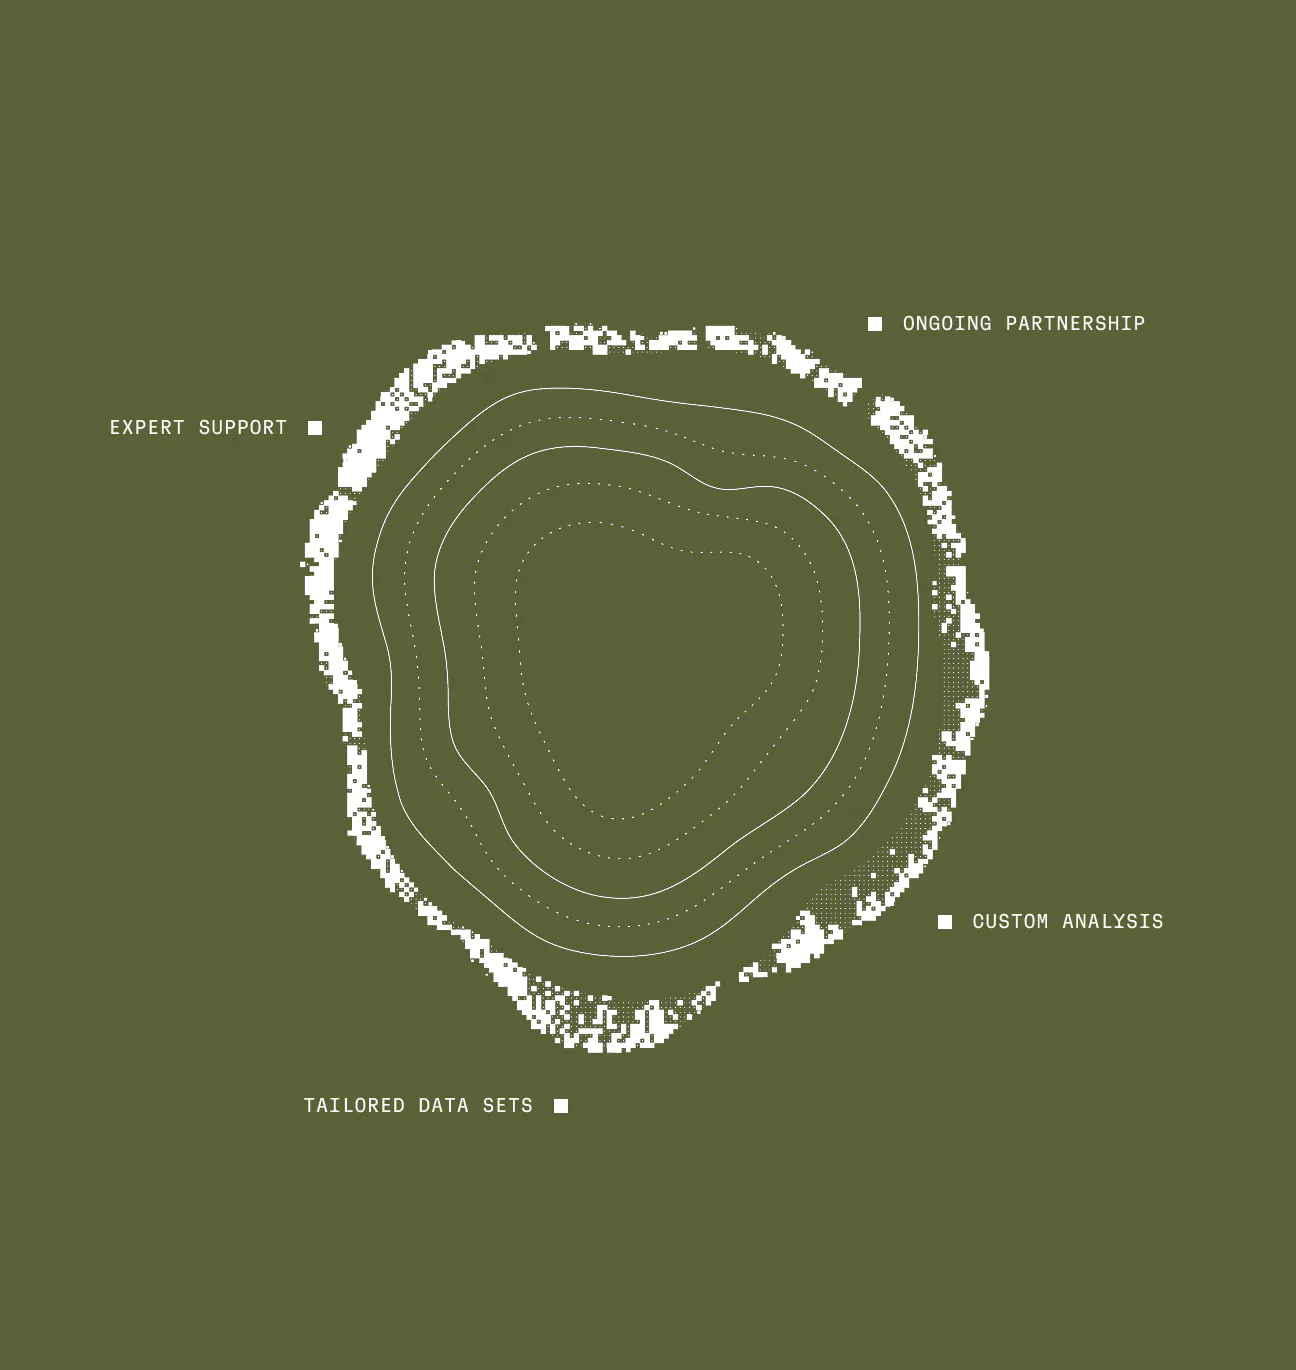
Chloris is a partner, not a data vendor. We work alongside your team from first feasibility through to verified, year-on-year monitoring, helping you design the approach, deliver the data, and stand behind the numbers.

We start by understanding your sourcing footprint and reporting needs. We then use our 26-year satellite archive, available at 10m and 30m resolution, to screen your areas of interest and assess feasibility before you commit.
We start by understanding your sourcing footprint and reporting needs. We then use our 26-year satellite archive, available at 10m and 30m resolution, to screen your areas of interest and assess feasibility before you commit.

We tailor our calibration to your specific commodities and geographies. Our approach draws on IPCC-recognized science and can incorporate your field data to further refine the results.
We tailor our calibration to your specific commodities and geographies. Our approach draws on IPCC-recognized science and can incorporate your field data to further refine the results.
We deliver annual carbon stock and carbon change data across your sourcing areas, distinguishing removals from emissions year on year. Each reporting cycle includes a documented methodology, supporting data, and a clear audit trail, with the approach for LSRS compliance pre-validated with SustainCERT.
We deliver annual carbon stock and carbon change data across your sourcing areas, distinguishing removals from emissions year on year. Each reporting cycle includes a documented methodology, supporting data, and a clear audit trail, with the approach for LSRS compliance pre-validated with SustainCERT.

Our involvement does not end at data delivery. We support your methodology design, help you interpret results, and work with you as frameworks evolve. We are committed to helping you report with confidence over the long term.

Our involvement does not end at data delivery. We support your methodology design, help you interpret results, and work with you as frameworks evolve. We are committed to helping you report with confidence over the long term.

Forests are a defining theme of COP30, both symbolically and substantially. Framed as the “Amazon COP”, a measure of success of this year’s COP will be progress made to strengthen policies and financing schemes for forest conservation and restoration.

Many financial institutions need to update how they assess their exposure to deforestation and land-use change emissions, and the update points in one direction: a geospatial lens on what is actually happening across the land their portfolios finance, as new net-zero standards are about to require banks and asset managers to measure and disclose the emissions embedded in their portfolios, including those tied to forests, land, and agriculture.

The Science Based Targets initiative published Version 2.0 of its Corporate Net-Zero Standard on 11 June 2026. The shift is from ambition to implementation. For most sectors that means greater flexibility in how targets are set and met. For companies sourcing forest and agricultural commodities, the implications are more specific because the most important changes sit in the treatment of Scope 3 emissions. The implications also carry a timing imperative: the evidence base the standard rewards takes years rather than months to assemble, so for a company that wants to use the new flexibility when V2.0 becomes mandatory on 1 January 2028, the work that matters should start soon.
Field inventories give detailed ground truth but are limited in coverage and costly to repeat. Satellite measurement provides consistent wall-to-wall coverage and can be updated annually. We use field and airborne LiDAR data to calibrate and validate our models, combining the reach of satellites with the rigour of ground measurement.
Yes. Data is delivered VVB-ready, with methodology documentation and a traceable path from satellite source data through to the final figure.
In systems where crops grow alongside trees, such as coffee or cocoa under shade, agroforestry stands span a narrower range of biomass values than natural forests, making reporting with remote sensing more challenging. We work with you to adapt our data to create tailored solutions for accurate reporting in your agroforestry systems.
Accuracy depends on the scale of analysis. For carbon accounting and MRV, what matters is the average biomass across a project area, not any single pixel — fine-scale errors partially cancel out when averaged, so site-level accuracy is consistently stronger than pixel-level accuracy.
At the site level, our model achieves an R² of 0.90 to 0.92; for mangroves, our dedicated model achieves an R² of 0.90. Every estimate carries a confidence interval — 95% by default — propagated from pixel to polygon level. Where field measurements are available, an optional post-calibration step can further reduce uncertainty locally.
Our methodology is built on IPCC-recognized science and published, peer-reviewed change-detection methods. Read our Methodology Paper

