Supplier-specific carbon data for FLAG accounting.
Chloris measures land use change emissions and removals at the parcels you source from. This is the primary, site-specific data the GHG Protocol LSR Standard and SBTi FLAG now require.

Chloris delivers the carbon data you need to meet reporting requirements with confidence.
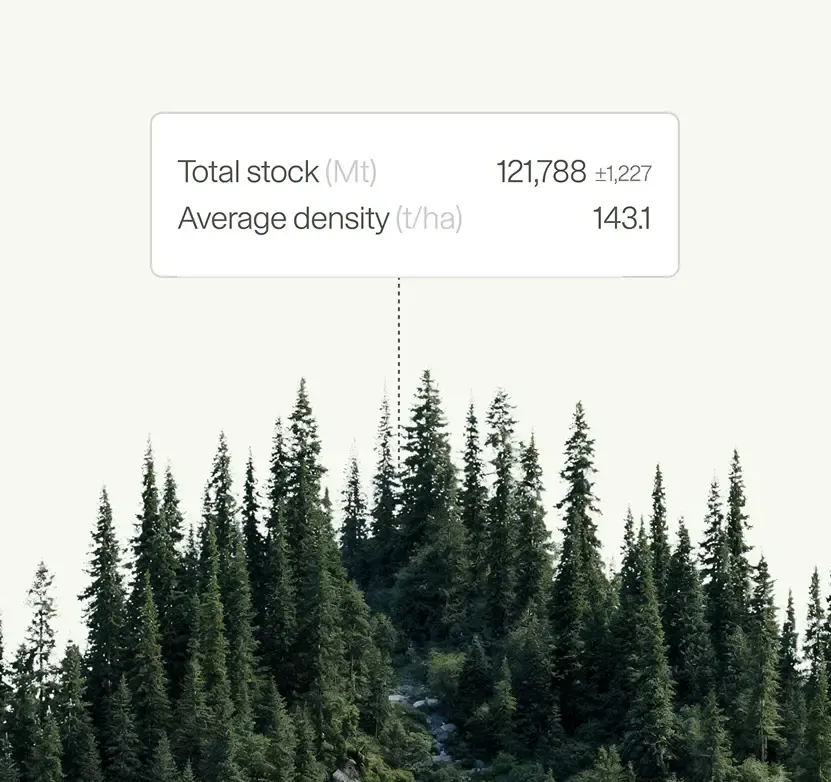
Site-specific emission factors for the parcels behind what you source, back through the baseline period.
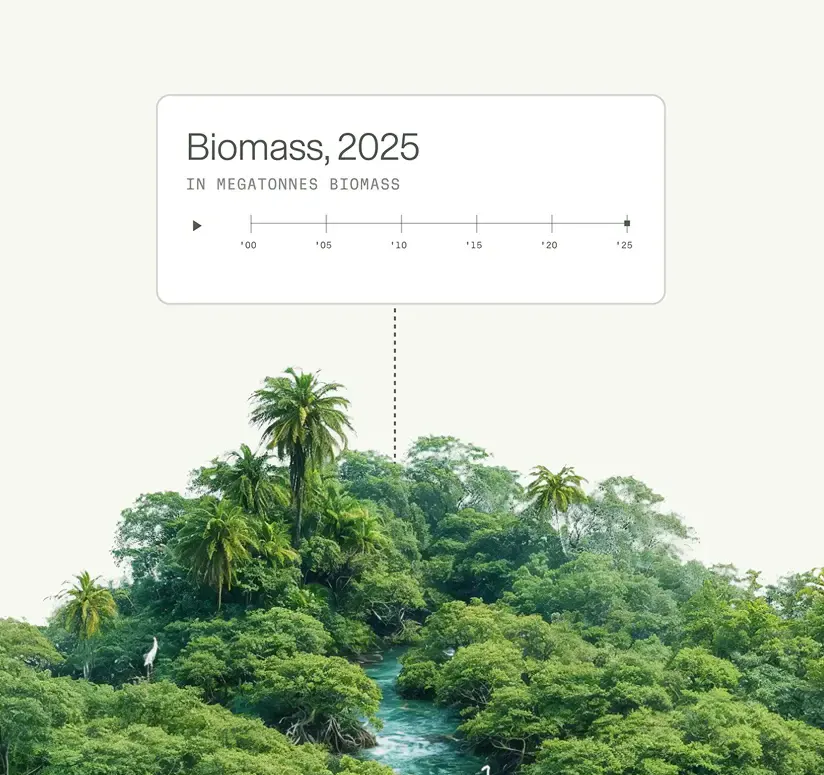
Growth measured rather than modelled, calibrated and validated against independent field data.
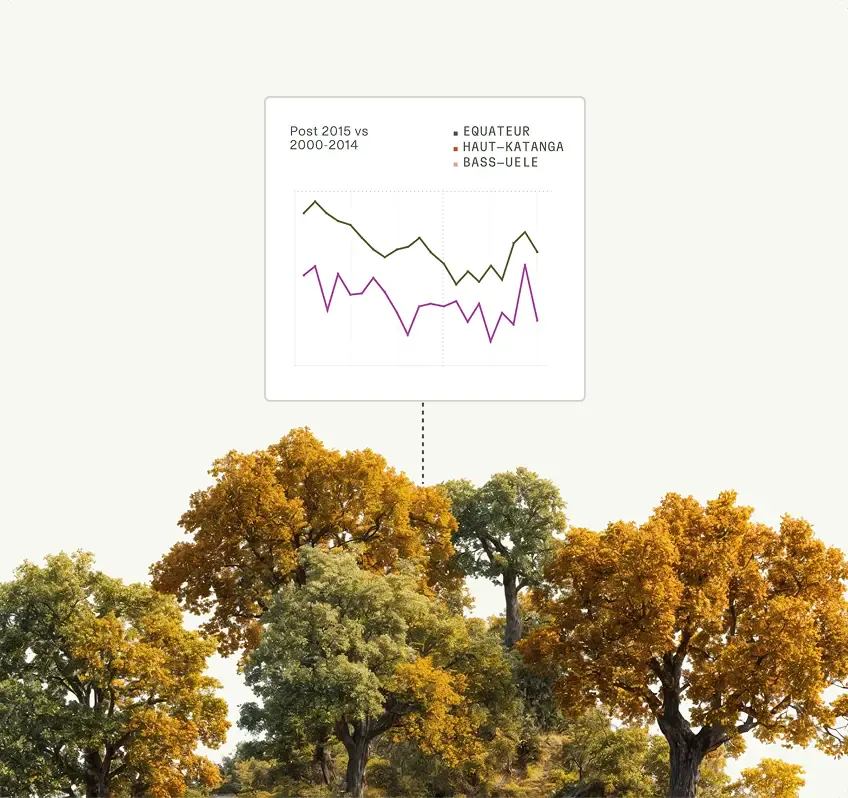
Assurance-ready outputs with documented methodology and a trail from source data to figure.
Default factors and regional averages cannot tell you what carbon stood on the land your commodities came from. Chloris reconstructs it directly from the satellite record, parcel by parcel, back through the relevant baseline period.
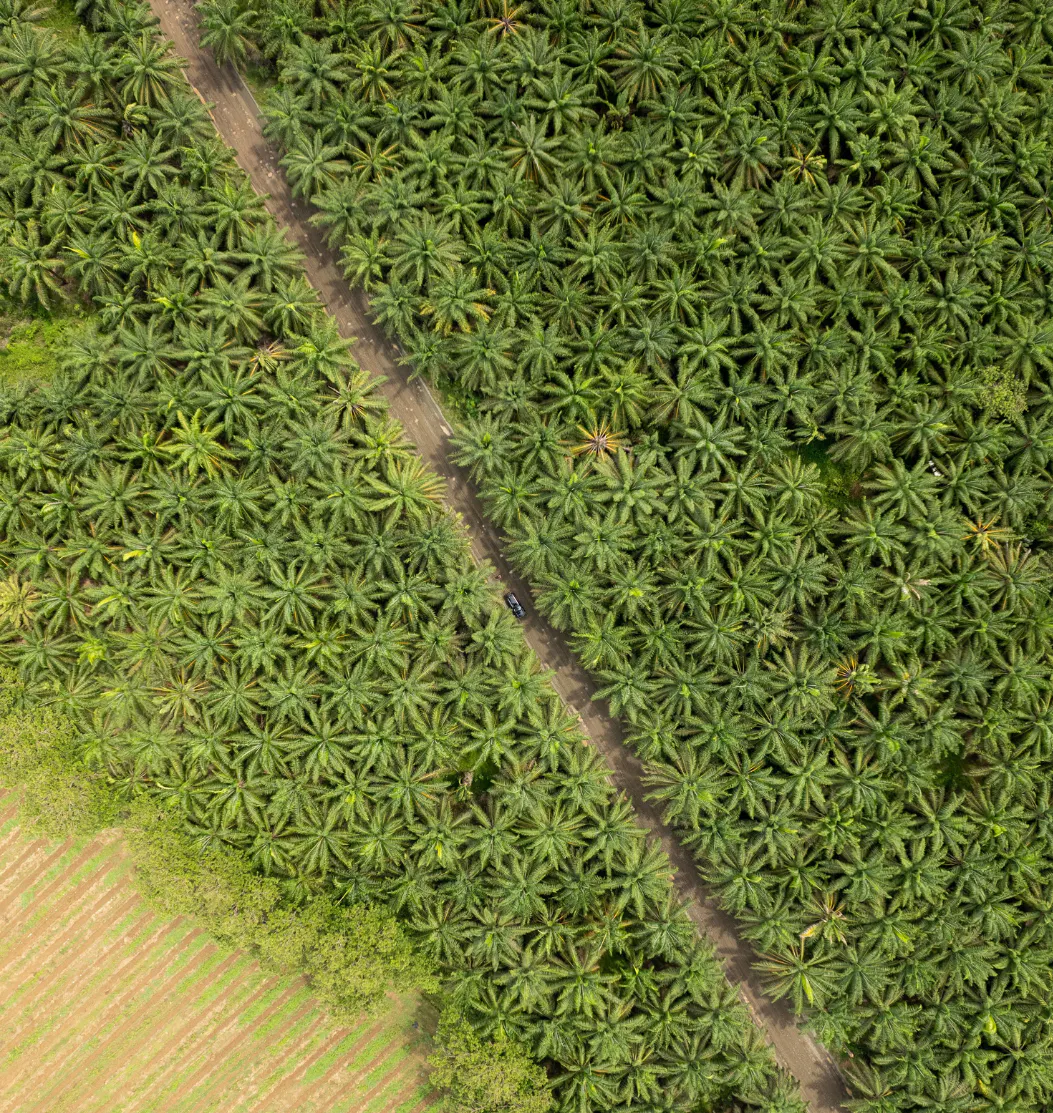
Our satellite archive, dating back to 2000, enables site-specific estimates of above-ground carbon stock for farms, plots, or sourcing areas before clearing. Estimates are based on the satellite record for the area, not a regional average, with a 95% confidence interval calculated at your reporting scale.
If you have parcel-level traceability, you already know where you're sourcing from. Chloris supplies the biomass data for those locations, giving you the site-specific inputs needed to report under the LSR Standard.
We quantify land-use change emissions at the farm, mill, province, or jurisdiction level (dLUC or jdLUC). The same underlying data can support your LSR inventory and SBTi FLAG tracking, whether you have parcel-level traceability or are working at a broader geographic level.
Reforestation, agroforestry, and improved land management can remove carbon by increasing biomass. To report those removals credibly, you need to track changes in biomass using primary data sources. Remote sensing can be one such source, providing a way to monitor above-ground biomass and its change over time across your sourcing areas.

The same satellite record that captures clearing also captures growth. We track annual above-ground biomass against a measured historical baseline, with a 95% confidence interval reported separately from emissions, as the LSR Standard requires.
Agroforestry stands, like cocoa or coffee under shade, are harder to measure than natural forest: biomass values sit in a narrower range, and shade trees need to be distinguished from crop trees. We work with companies on a bespoke basis to build the right approach for these systems.
Removals data estimation is backed by a methodology pre-validated with SustainCERT, with a clear trail from source data to the final figure.
This validation framework is what distinguishes primary data from modelled estimates.

When needed, we compare and adjust our data (from spaceborne LiDAR, airborne LiDAR, and imagery) against field measurements collected on the ground.

An independent set of field measurements, withheld from calibration, is then used to test the calibrated estimate.

A statistical test checks whether the difference between satellite and field data is acceptable. If it isn't, the model's uncertainty is adjusted across the project area.
Environmental disclosures face growing scrutiny from auditors, regulators, and investors, because a number is only as useful as the evidence behind it. Chloris delivers documented, repeatable measurements, with the methodology and audit trail a third party needs to sign off.

Every metric arrives with full methodology documentation, a quantified 95% confidence interval, and a transparent trail from satellite source data through to the final figure. An auditor can follow any number back to the observations it came from.
Our LSRS methodology is pre-validated by SustainCERT, so auditors reviewing your outputs are working from a process that has already been assessed against the standard: they can have confidence in how the numbers were produced.
The measurement comes from satellite observation rather than questionnaires returned by farmers and traders, so your disclosure doesn't rest on data quality you have no way to check.
You collect supplier locations and define spatial boundaries for one or two priority commodities.
You collect supplier locations and define spatial boundaries for one or two priority commodities.
Chloris quantifies land use change emissions and removals across those locations.
Chloris quantifies land use change emissions and removals across those locations.
Outputs are aligned with GHG Protocol and SBTi requirements, delivered FLAG-ready.
Outputs are aligned with GHG Protocol and SBTi requirements, delivered FLAG-ready.
You integrate the outputs into your annual GHG inventory, then scale to the full supplier base.
You integrate the outputs into your annual GHG inventory, then scale to the full supplier base.


Share boundary files for one or two priority areas and we will generate Chloris the data, then scope a pilot together.


