

Data to boost your impact, integrity, and efficiency. At any scale.
New Feature: Biomass at Risk for Portfolio Monitoring

Above-ground biomass stock
Annual data on above-ground biomass and carbon stock since the year 2000. At 30m and 10m resolution and quantified uncertainty for every pixel.
Above-ground biomass change
Annual data on above-ground biomass and carbon change since the year 2000. At 30m and 10 resolution and quantified uncertainty for every pixel.

Forest cover
Annual data on forest cover dynamics since the year 2000, including forest area gains, deforestation and degradation, and related carbon removals and emissions.NEW Feature: Biomass at Risk
Know where your carbon is at risk before it becomes a liability. 30 meter resolution — Updated monthly — Site bounded.
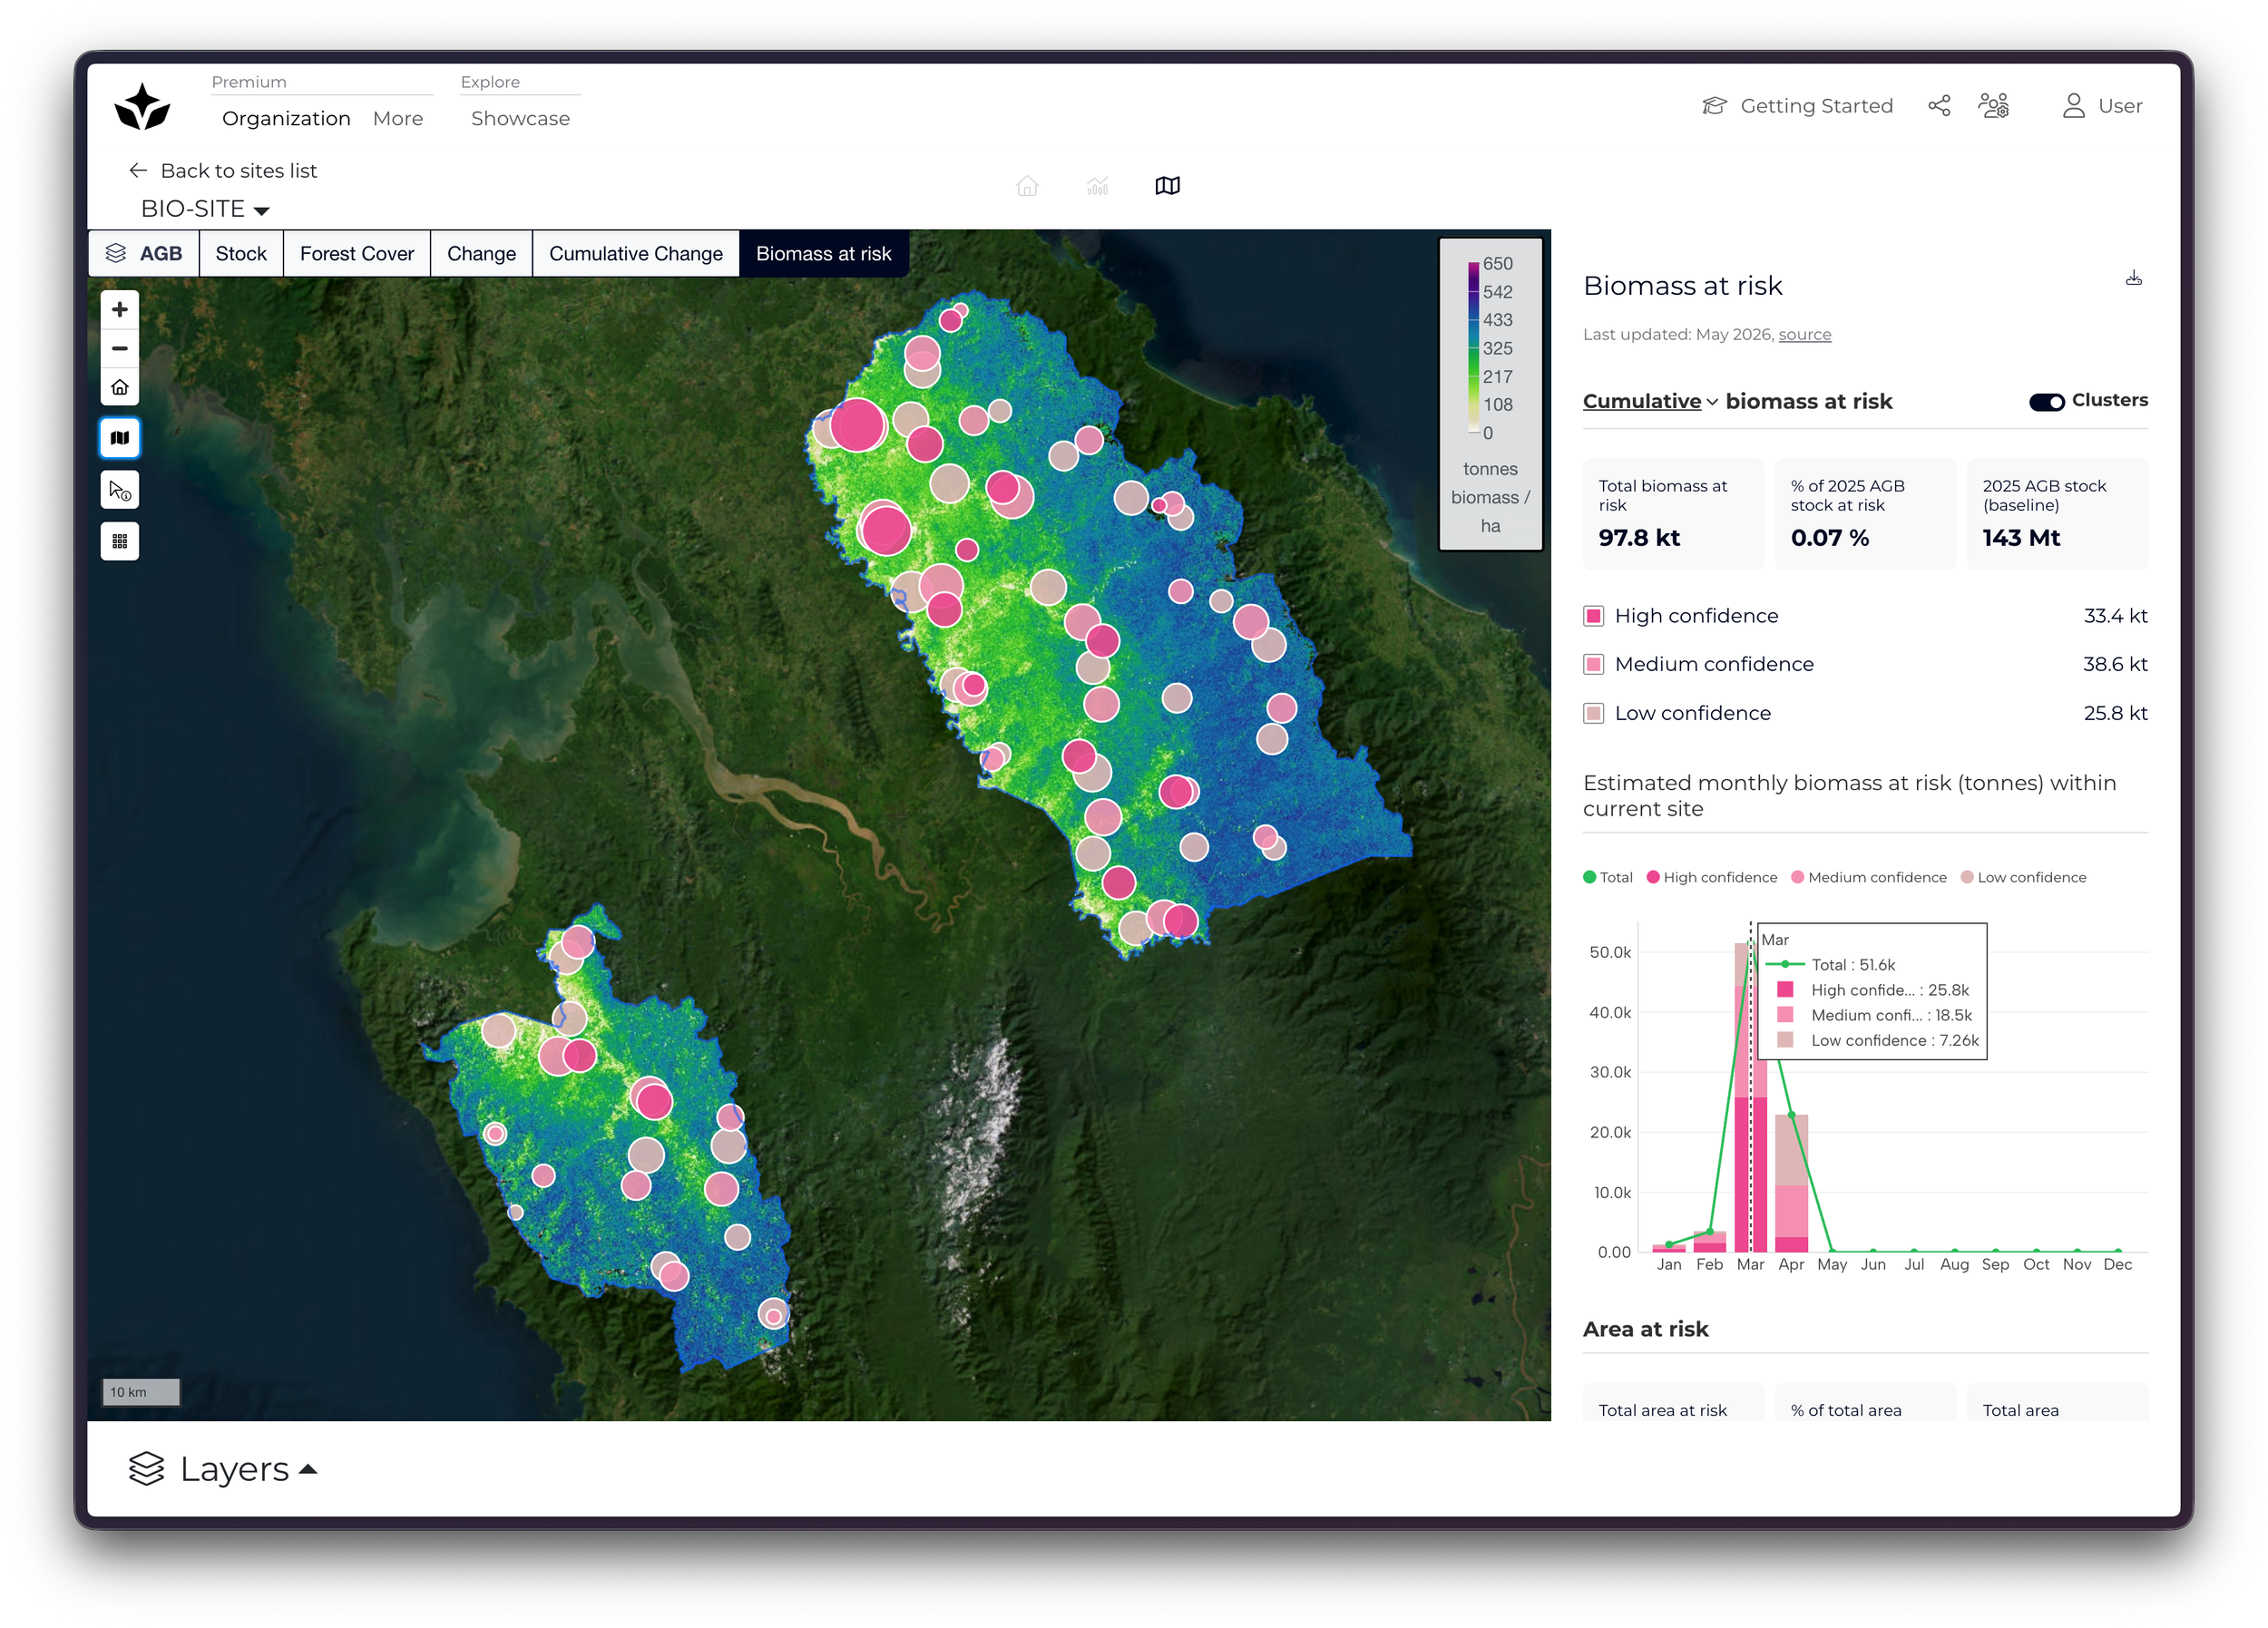
Biomass & area statistics
Total tonnes at risk measured against your 2025 AGB baseline, alongside hectares affected and percentage of site, broken down by confidence level.
Biomass at Risk connects near-real-time deforestation alerts to your project's above-ground biomass data, giving you the earliest possible warning of threats to permanence, directly inside the Chloris platform.
High confidence: Alerts with strongest satellite signal, prioritize immediate responseMedium confidence: Monitor closely; likely deforestation with some uncertaintyLow confidence: Early signals, track over coming months before acting
Permanence intelligence
Translates raw satellite signals into the biomass and carbon stock language registries and buyers rely on, so your team can respond with confidence, not guesswork.
Monthly trend charts
Stacked bar charts with trend line overlay, covering February through December. See whether risk is growing, stable, or receding across your portfolio.
Early warning by design
Monthly updates surface threats weeks or months before manual monitoring catches them, giving project teams time to act before permanence buffers are at stake.
Cluster drill-down
Modal breakdown of risk concentration within areas of dense alerts, understand which pockets of your site are under the most pressure.
Site-bounded map layer
Deforestation alerts overlaid on satellite imagery, clipped exactly to each project boundary. Color-coded by confidence tier for instant prioritization.
Our technology
The Chloris technology delivers direct estimates of above-ground biomass (AGB) stock and change at operational scale resolution, anywhere on the planet. Our approach generates robust, spatially explicit estimates of biomass change and related carbon emissions and removals, with pixel-level quantified uncertainty. The technology delivers continuous, wall-to-wall estimates with full scalability in space and time. 
-
We build continental-scale models to predict biomass using millions of pre-filtered, spaceborne and airborne LiDAR estimates. Our models are validated with extensive airborne LiDAR and field data. This allows to capture the full range of variation in carbon density over the region of interest.
-
We derive features from state-of-the-art fusion of active and passive Earth observation and ancillary data. We leverage the unique capability of each sensor to provide measurements of the state of natural ecosystems. This technique allows us to overcome limitations where data gaps exist in time and space, and produces reliable inputs to our machine learning model for wall-to-wall biomass estimates.
-
We build machine-learning models anchored in state-of-the-art data science. Our models are based on highly curated features that, when combined with LiDAR measurements, generate high spatial resolution time series of carbon stock and change over long periods. Our continental scale models are capable of producing on-demand, wall-to-wall maps of above-ground carbon stocks and change, at annual time steps with a spatial resolution of 10 or 30 meters.
-
Our cloud-based pipeline processes annual carbon stock estimates since the year 2000 at each grid cell using Bayesian time series methods to remove noise in the time series and confidently identify statistically significant changes and trends in carbon stocks across time, with quantified uncertainty at the pixel level.
Reliable data, independently validated
The accuracy of biomass estimates has direct repercussions on the integrity of carbon finance and corporate claims related to forest conservation and restoration programs.To make accuracy estimates safe to use for customers, we validate our estimates against fully independent, higher-quality data, not used to train the algorithm.


-
We have tested our technology against ALS biomass estimates published by independent research centers and find that we can consistently provide accurate estimates at all scales. Crucially, our ability to measure change from one year to the next is consistent with the long-term dynamics monitored through airborne LiDAR at sites with multi-year monitoring measurements.
-
The Ecosystem Restoration Standard (ERS) conducted an AGB Benchmarking Exercise to assess the quality of the data produced by different service providers. For that purpose, ERS acquired a high-quality biomass dataset derived from LiDAR + UAV LiDAR measurements over a 50k hectare site in Mozambique. The comparison showed that Chloris (referred to as Participant A in the study) performed significantly better than any other data provider participating in the test.
-
Comparing biomass estimates derived from remote-sensing data against biomass estimates derived from field plots—a plot-to-pixel comparison—is more challenging than comparing two remote-sensing derived biomass datasets. Factors complicating plot-to-pixel comparisons include the often small size of plot size, geolocation error and human error when setting up field plots.
Nevertheless, we validated our estimates against field data collected across the tropics, the GeoTrees Network, and found compelling results.