23rd September 2026
Case Study
17 minute read

A carbon credit is essentially a measurement claim. It says that a specific quantity of carbon, one metric tonne of carbon dioxide, has been removed or kept out of the atmosphere, and verified against an established standard. Forests are among the most important natural systems for doing this work, absorbing and storing carbon in their biomass and soils over decades, or even centuries. Everything the voluntary carbon market has been working towards over the past few decades, from additionality, permanence and baselines through to credible corporate emissions claims, eventually comes back to confidence in the numbers.
The Katingan Mentaya Project in Central Kalimantan Province, Indonesia, protects 157,875 hectares of peat-swamp forest between the Katingan and Mentaya rivers. A triple gold rated forest carbon project, it generates an average of 6 million verified carbon units (VCUs) or carbon credits per year. It is a large, forested landscape, with deep peat soil underneath. There is no question that if the forest were to be cleared, the peat drained and the land converted, the resulting carbon dioxide emissions would be substantial. Its protection provides clear and significant climate benefits. But for the carbon credits the project generates to accurately compensate for actual, real-world emissions, there needs to be confidence in the overall volume of emissions the project is preventing.
This case study is about the challenges of measuring complex forest landscapes and how accurate measurements are being achieved by combining fieldwork and layered datasets with satellite-based biomass mapping from Chloris.

A carbon project that is mostly underground
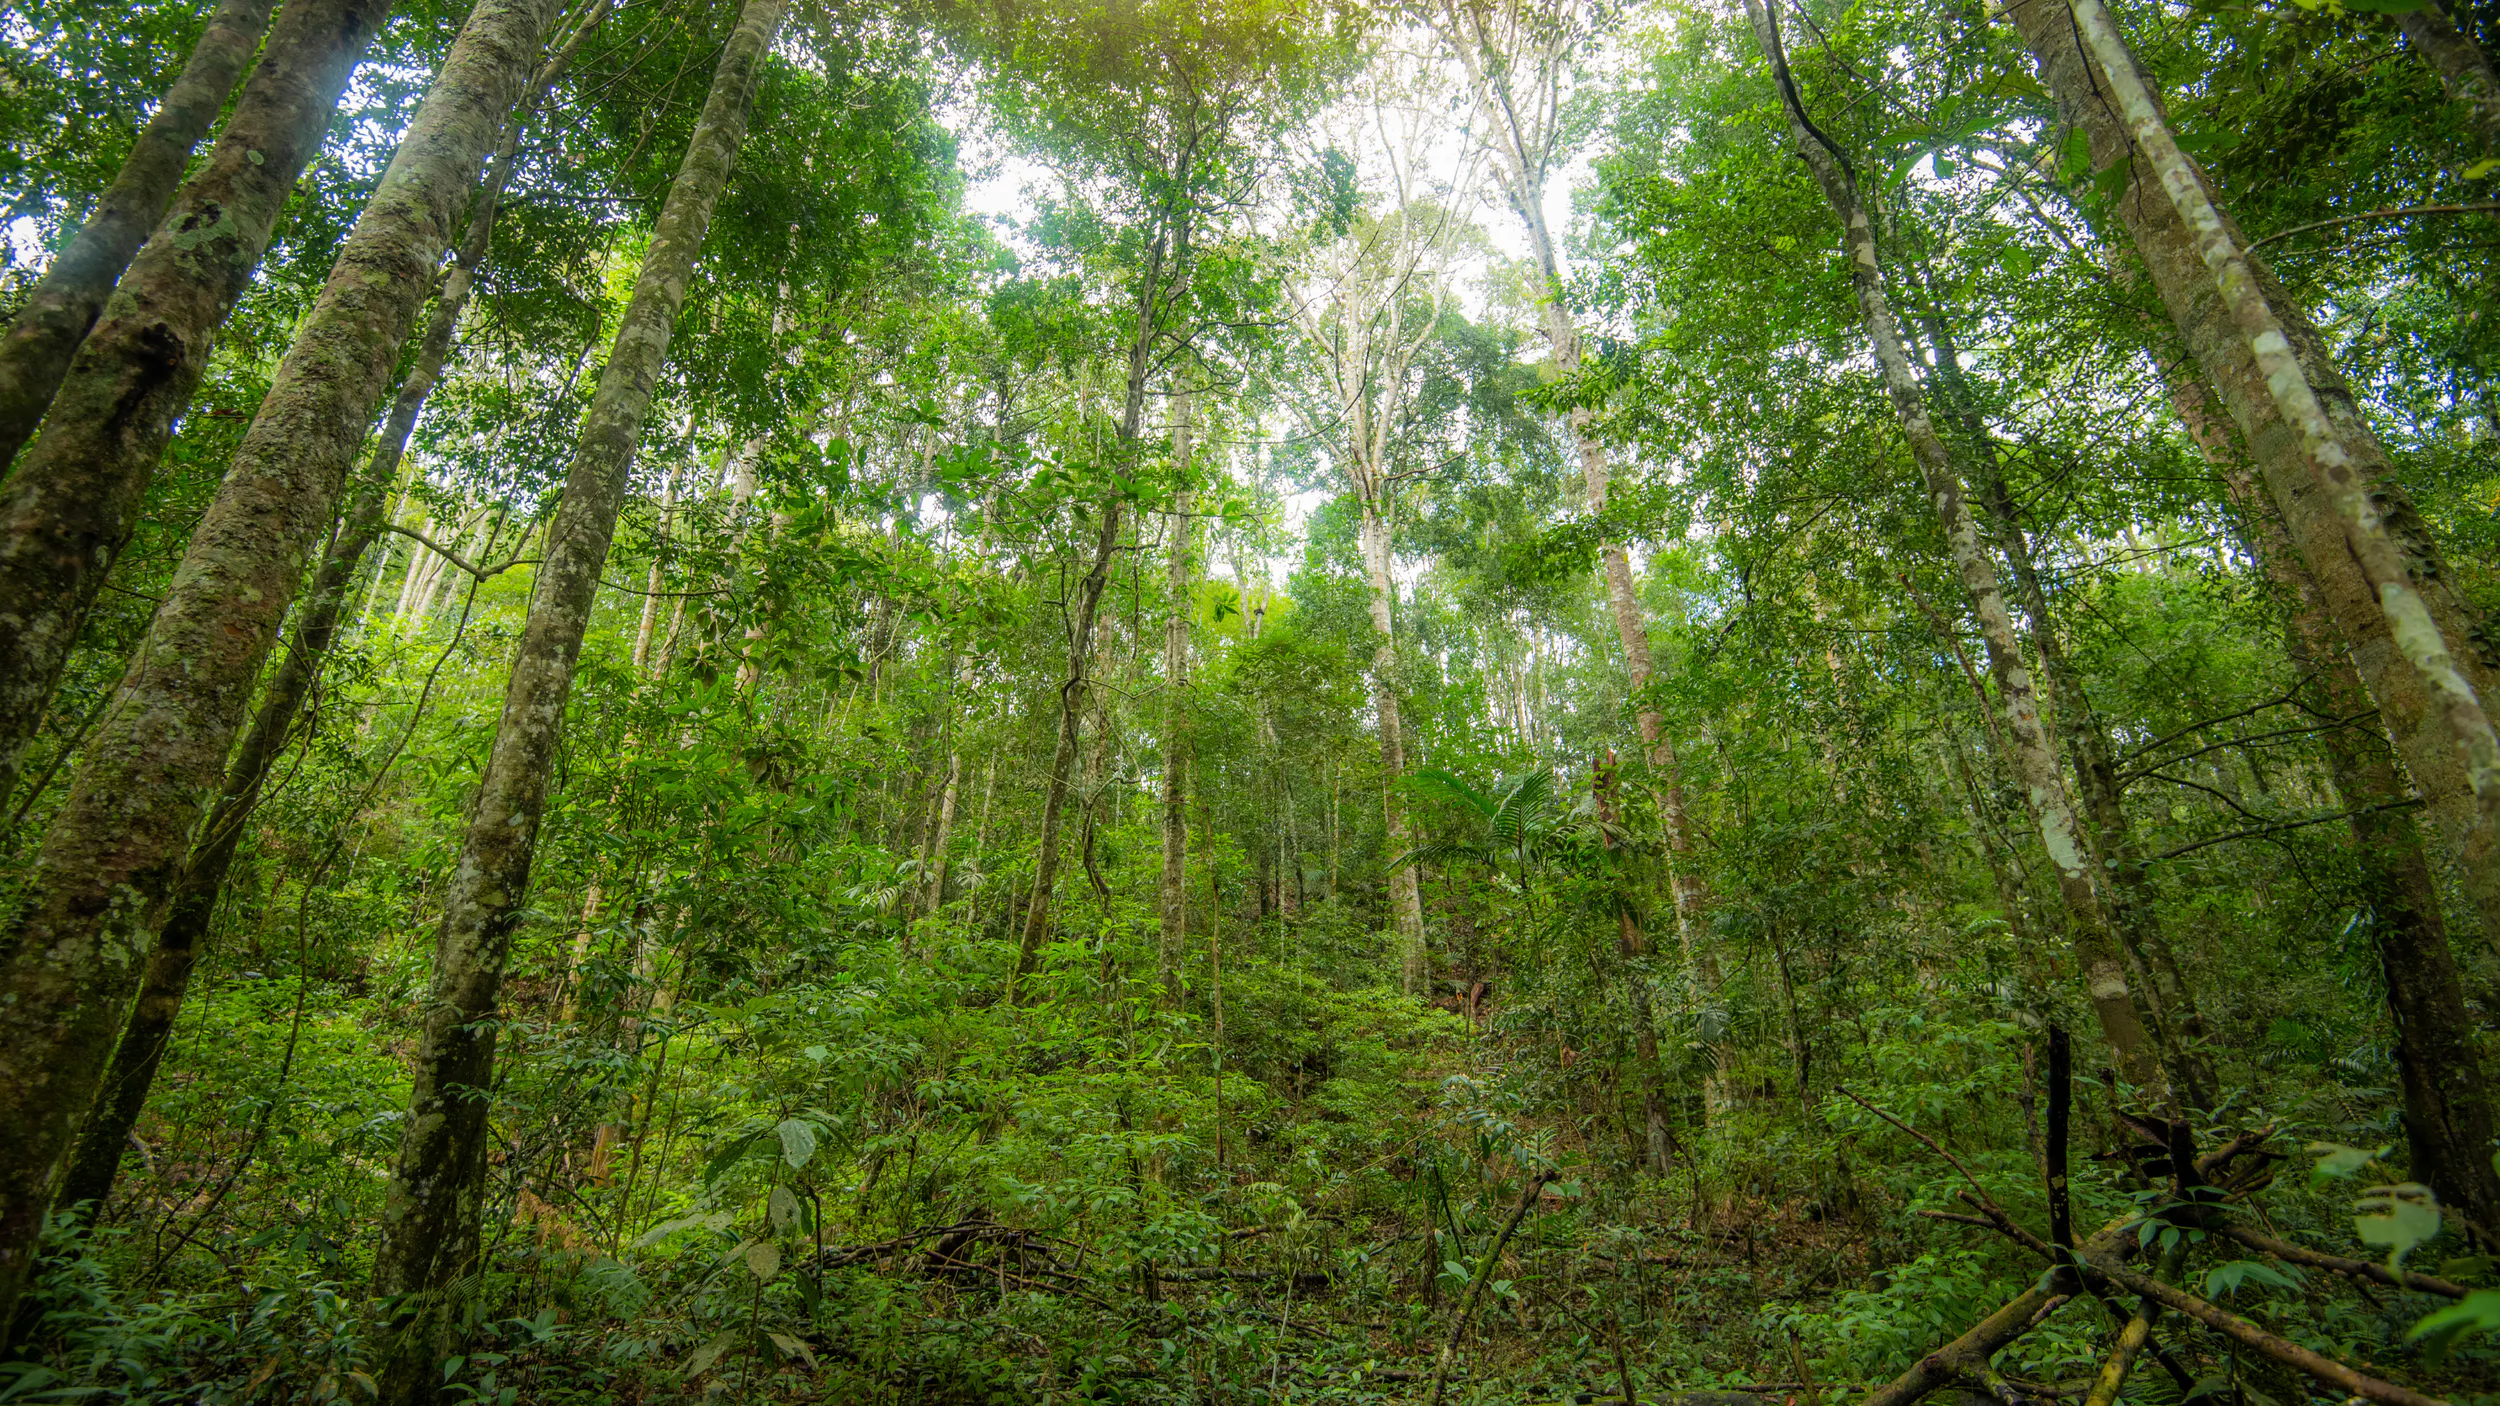
Katingan sits on a peat dome, a large, slightly raised body of waterlogged, partially decomposed plant material that has been accumulating for thousands of years. The living forest on top is dense and tropical: at least 272 tree species (including four critically endangered) that provide habitat for a wide range of endangered species, including Bornean orangutans, proboscis monkeys, Sunda pangolins and at least thirty other high-conservation-value species. It is vital in terms of its biodiversity value, but from a carbon accounting point of view, the trees play a small role. Every trunk, branch and leaf of aboveground biomass constitutes around a tenth of the carbon on the site. The majority is locked in the peat below.
Peat that stays saturated and forested remains a carbon store. When it is drained, cleared or burned, it becomes one of the most carbon-dense emission sources of any landscape on Earth, oxidising and releasing carbon that took millennia to accumulate.
The project has been running for a decade and half. PT Rimba Makmur Utama (RMU) applied for an Ecosystem Restoration Concession over the area in 2008 and was granted it in 2013, with the 60-year concession. Today, it works with 41 villages across the project zone, through 80 formal Memoranda of Understanding. The project’s carbon revenue has enabled a wide range of programmes that are supporting livelihood opportunities, while also delivering health and education improvements.
Permian Global, has been the long-term development partner throughout and is responsible for scientific design, monitoring methodology and technical reporting that turned a concession into a verified, viable project.
The threat to the landscape is well evidenced. Across Central Kalimantan, peatland of exactly this kind has been drained by canal networks, cleared for agriculture and plantation, and burned, sometimes catastrophically. Fire is the most destructive and indiscriminate threat. The project's response is layered: extensive data-driven planning and preparation, trained village fire brigades, canal-blocking and rewetting to keep the water table high, and state-of-the-art continuous monitoring. Across the most recent monitoring period (2020–2023) it recorded zero project fires.

The measurement challenge
The tropical peat-swamp forest is heterogeneous at every scale. Biomass varies between a riverine fringe and the centre of the dome, between intact forest and patches recovering from old disturbance, between one year and the next. Traditional carbon accounting handles this with field plots, which involves teams that walk into the forest for days, laying out fixed-area plots, measuring every tree above a threshold diameter, and converting those measurements into carbon using allometric equations. This is the bedrock of the science and it is the only way to get a direct, physical measurement of what is actually growing on a given patch of ground.
Plots, however, cover only a small fraction of the project’s 157,875 hectares. Turning field measurements into a project-wide figure requires extrapolation, which introduces uncertainty and in a mosaic landscape like the Katingan Mentaya Project, that uncertainty can be substantial. The challenge, then, was to quantify this uncertainty at the pixel level across the entire project area, and to use it actively to guide where measurement effort should be concentrated.
Turning field measurements into a project-wide figure requires extrapolation, which
introduces uncertainty and in a mosaic landscape like the Katingan Mentaya Project, that uncertainty can be substantial. The challenge, then, was to quantify this uncertainty at the pixel level across the entire project area, and to use it actively to guide where measurement effort should be concentrated.

The data stack
To address this uncertainty the project has built a wall-to-wall, high-resolution map of above-ground biomass for the entire project area. This avoids a single average by creating a value for every 30-metre pixel, which is then anchored in physical field data. Without the historical time series and pixel-level uncertainty that Chloris provides, the field plots and satellite streams would produce a snapshot; but together, they produce a system.
The stack has three layers. At the base are the field plots: representative vegetation surveys across the concession to estimate above-ground carbon density directly, in line with current standards.
Above that sit the satellite data streams. NASA's GEDI mission (a spaceborne LiDAR instrument on the International Space Station) fires laser pulses that measure vegetation structure and height in 25-metre footprints, creating a three-dimensional picture of the forest. The Harmonized Landsat and Sentinel-2 (HLS) dataset supplies frequent optical imagery, valuable in a region where persistent cloud cover limits many sensors. Sentinel-1 Synthetic Aperture Radar penetrates cloud and canopy to add structural information in all weather conditions. GEDI's precise but spatially scattered measurements are used to train models (31 of them in the renewed workflow) that predict forest structure continuously across the whole project area from the HLS and radar data.
The third layer is data supplied by Chloris. Chloris is a science-led nature tech company founded in 2021 by forest scientists and climate researchers including Marco Albani and Alessandro Baccini. It produces wall-to-wall, annual measurements of carbon stock and change in woody vegetation, at 30-metre resolution, with quantified uncertainty for every pixel, reaching back to the year 2000. That historical reach matters: means that the project can reconstruct a biomass time series for the landscape before monitoring began, rather than relying only on snapshots from the present alone.
Added together, these layers produce a locally calibrated biomass map for the whole project, validated against held-out field data. In the baseline that model achieves an R2 of 0.82 with a mean bias of roughly −2 tonnes per hectare i.e. strong agreement with field measurements and, if anything, a slight tendency to understate biomass, which is the conservative direction for a carbon claim. Critically, every pixel also carries a calibrated 90% prediction interval, generated with a distribution-free conformal method. The map shows how much carbon is in each pixel and how confident that estimate is.
The two models play different complimentary roles. The Chloris model is global. It is trained on datasets drawn from woody vegetation worldwide, and from these it produces wall-to-wall annual biomass stock and change at 30-metre resolution, with per-pixel uncertainty, reaching back to 2000. Its strength is coverage, consistency and historical depth. However, for any single forest, it has not been trained on that area’s own field data, so in a landscape as specific as Katingan's peat-swamp some local bias is expected. Permian's model is local. It is an XGBoost model calibrated directly on 94 field plots surveyed at Katingan (14,788 individual trees), and it fuses the GEDI-derived structure maps, the HLS optical and Sentinel-1 radar streams, and the Chloris biomass product, which enters as one of fourteen input features rather than as the answer itself. The result is a biomass map tuned to Katingan's forest and tested against held-out local plots: under spatial cross-validation it achieves an R² of 0.82 and a root-mean-square error of about 30 tonnes per hectare, accuracy that surpasses many existing biomass products, with a slight conservative bias of roughly −2 tonnes per hectare and a calibrated 90% prediction interval on every pixel. The global product supplies reach and historical context; the local model supplies the ground-truth calibration and quantified confidence that the carbon accounting rests on.

Chloris in practice
Permian is now in its third year of using Chloris data. Three uses show what pixel-level biomass-with-uncertainty actually buys a project on the ground.
1. Sampling where it is needed
Because the Chloris maps quantify uncertainty everywhere, field effort can be aimed rather than spread evenly. In practice, Chloris helps optimize the number of field plots a project needs. A stratified sampling design uses the maps to concentrate plots in areas where biomass is most variable or least certain, and to ease off where variance is already low and extra plots would add little. Instead of sampling blindly and hoping for representativeness, the team samples to shrink the uncertainty where it is needed, which results in a more efficient use of field budgets.
2. Knowing where the forest ends
In a peat-swamp landscape the boundary between forest, degraded scrub and open wetland can be highly ambiguous and not fixed. High-resolution, spatially explicit biomass mapping helps make boundaries legible, distinguishing forest from wetland, and intact from degraded, so that what is counted as standing, carbon-bearing forest is delineated consistently and defensibly rather than by judgement call. In a landscape of 157,875 hectares, even small boundary misclassifications compound into material differences in the carbon estimate.
3. Seeing change as a film, not a photograph
Because the data runs annually back to 2000, the project can track change through time rather than comparing two distant snapshots. Carbon losses from a fire, and the slower recovery of biomass after historical logging, show up as a trajectory, with the statistical machinery to flag which changes are real and which are noise. For a peatland whose whole risk profile is about disturbance and recovery, a time series is more valuable than a single date stamp. It also makes performance verifiable: the zero-fire record across 2020–2023 is not an assertion but an observation backed by two decades of continuous data.

Outcomes
The combination of Chloris biomass mapping with field data and satellite streams delivers three concrete advantages for a project like Katingan Mentaya.
Defensible numbers
The baseline model achieves an R² of 0.82 against held-out field data, with a mean bias of roughly −2 tonnes per hectare. That slight tendency to understate biomass matters: in a market where ratings agencies, auditors and corporate buyers are paid to be sceptical, a conservative estimate with quantified uncertainty is more durable than a higher number without it. Every pixel carries a calibrated 90% prediction interval, which means that when scrutiny comes, the project can answer "how do you know?" in spatially explicit, statistical terms rather than by assertion alone.
More efficient field programmes
Pixel-level uncertainty quantification changes how field budgets are spent. Rather than spreading plots evenly and hoping for representativeness, Permian can concentrate effort in areas where the Chloris maps show high biomass variability or low confidence, and reduce sampling in areas that are already well-characterised. The result is better statistical confidence for less field cost, fewer wasted plots in well-understood terrain, more where they move the needle.
A time series
Because Chloris data runs annually back to 2000, Katingan Mentaya can reconstruct what the landscape looked like before the project began, track how it has changed year by year, and distinguish real carbon signals from noise. For a peatland whose entire risk profile centres on disturbance and recovery, fire, drainage, encroachment, this longitudinal view is more valuable than any single measurement date. It also strengthens baseline credibility, since the pre-project trajectory is observable rather than assumed.
Because Chloris data runs annually back to 2000, Katingan Mentaya can reconstruct what the landscape looked like before the project began, track how it has changed year by year, and distinguish real carbon signals from noise. For a peatland whose entire risk profile centres on disturbance and recovery, fire, drainage, encroachment, this longitudinal view is more valuable than any single measurement date. It also strengthens baseline credibility, since the pre-project trajectory is observable rather than assumed.

Conclusion
The Katingan Mentaya Project illustrates a broader truth about the voluntary carbon market: that the credibility of a carbon claim is only as strong as the measurement framework behind it. In a landscape where the majority of carbon is locked in peat below ground, a point-in-time estimate based on field plots alone is not sufficient. What is needed is a system that combines direct physical measurement with spatially continuous, annually updated, uncertainty-quantified data.
That is what the integration of Chloris Geospatial data with Permian Global's field programme and satellite data streams provides. The result is a more defensible project that can show its working, quantify its confidence, direct its resources efficiently and demonstrate performance over time rather than at a single moment.
For the voluntary carbon market to fulfil its potential as a tool for climate action, this kind of rigour needs to become the norm rather than the exception. Projects that can answer scrutiny with numbers, that can show where their estimates come from, their uncertainty estimates, and how that uncertainty is being actively reduced will be better positioned to withstand the scepticism of ratings agencies, auditors and corporate buyers, and to build the long-term trust the market depends on.
Katingan Mentaya, and the measurement framework behind it, is an example of what that looks like in practice.
What is needed is a system that combines direct physical measurement with spatially continuous, annually updated, uncertainty-quantified data. That is what the integration of Chloris Geospatial data with Permian Global's field programme and satellite data streams provides. The result is a more defensible project that can show its working, quantify its confidence, direct its resources efficiently and demonstrate performance over time rather than at a single moment.

Forest carbon projects are built on a promise of permanence. But the threats to permanence can materialize in days, and the tools most project teams rely on to detect them were never designed to answer the question that matters most: how much carbon is actually at risk?

ARR (Afforestation, Reforestation, and Revegetation) projects are on the rise as a powerful way to restore ecosystems and remove carbon. To ensure these projects are credible and high-impact, several methodologies have adopted dynamic baselines to compare actual gains to what would have happened without intervention on an ongoing basis.


