From screening to MRV, data you can act on.
Chloris delivers the data and workflows carbon market developers, investors, and portfolio managers need to move with confidence.


From screening a candidate site to monitoring a portfolio, Chloris delivers the measured biomass data carbon projects are valued and verified on.
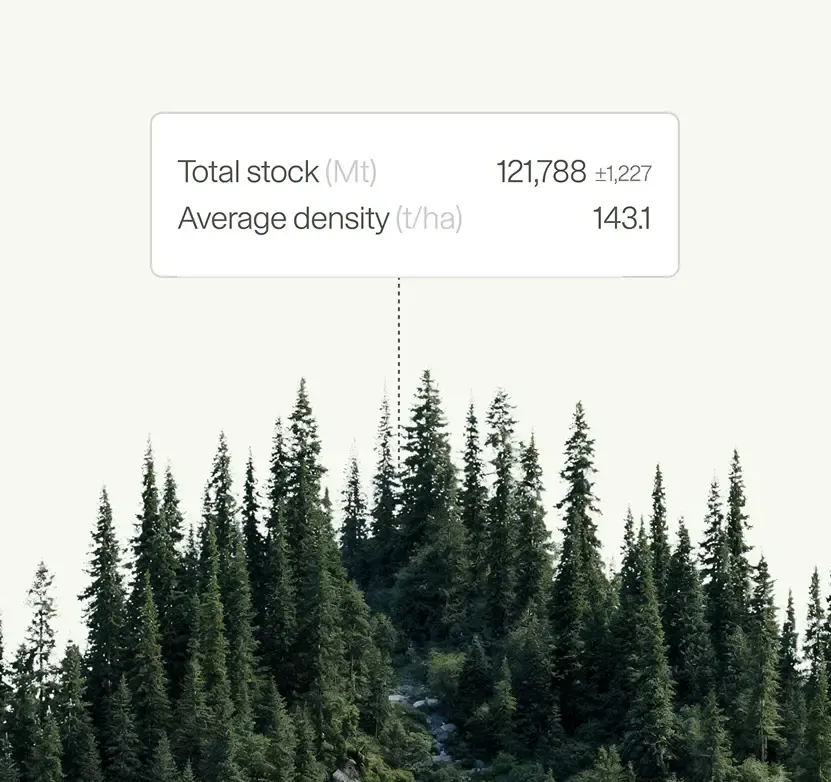
Screen and compare forest carbon projects across any geography before deploying teams or capital on the ground. 26 years of consistent, validated data, anywhere on Earth.
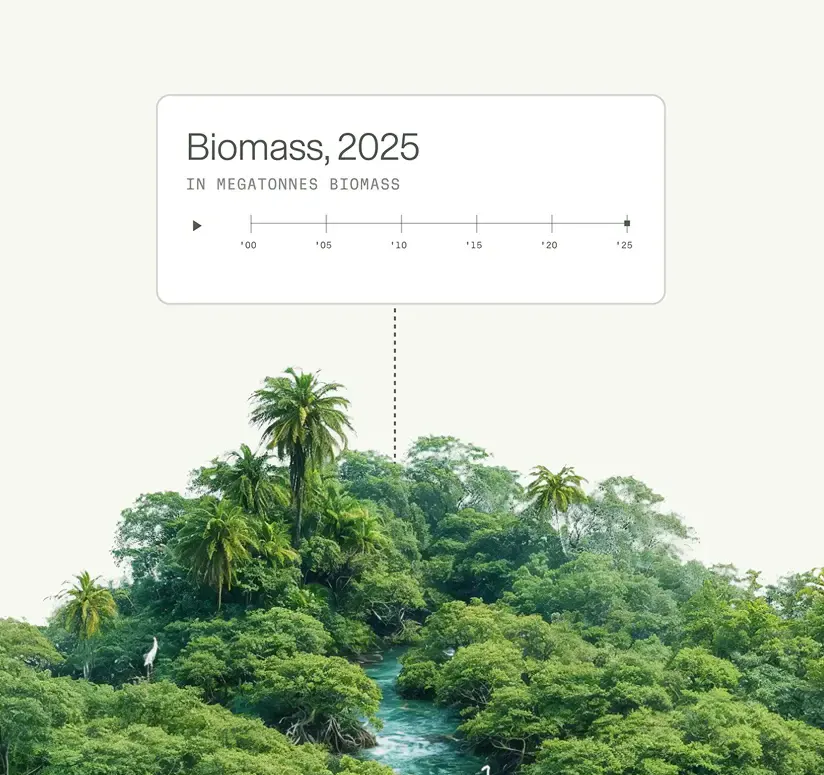
Track biomass performance, manage portfolios, and deliver credible insights that support confident decision-making across multiple forest sites.
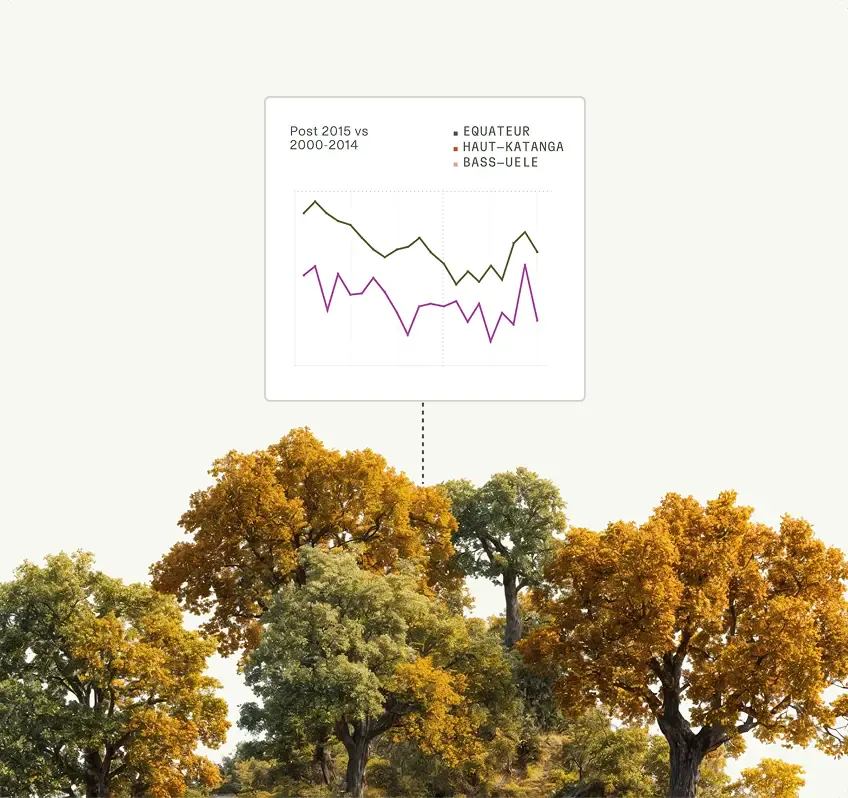
From project boundary to VVB-ready deliverables in 30 days or less, built on direct biomass data that holds up under scrutiny.
Screen and compare forest carbon projects across any geography, before deploying teams or capital on the ground.
by area definition
DRAW - Polygon, rectangle, or circle, with fine-tuning on the map.
UPLOAD - Shapefile, KML, or GeoJSON for boundaries you already hold.
EXPLORE - Search any country, jurisdiction, region, city, or lat-long.
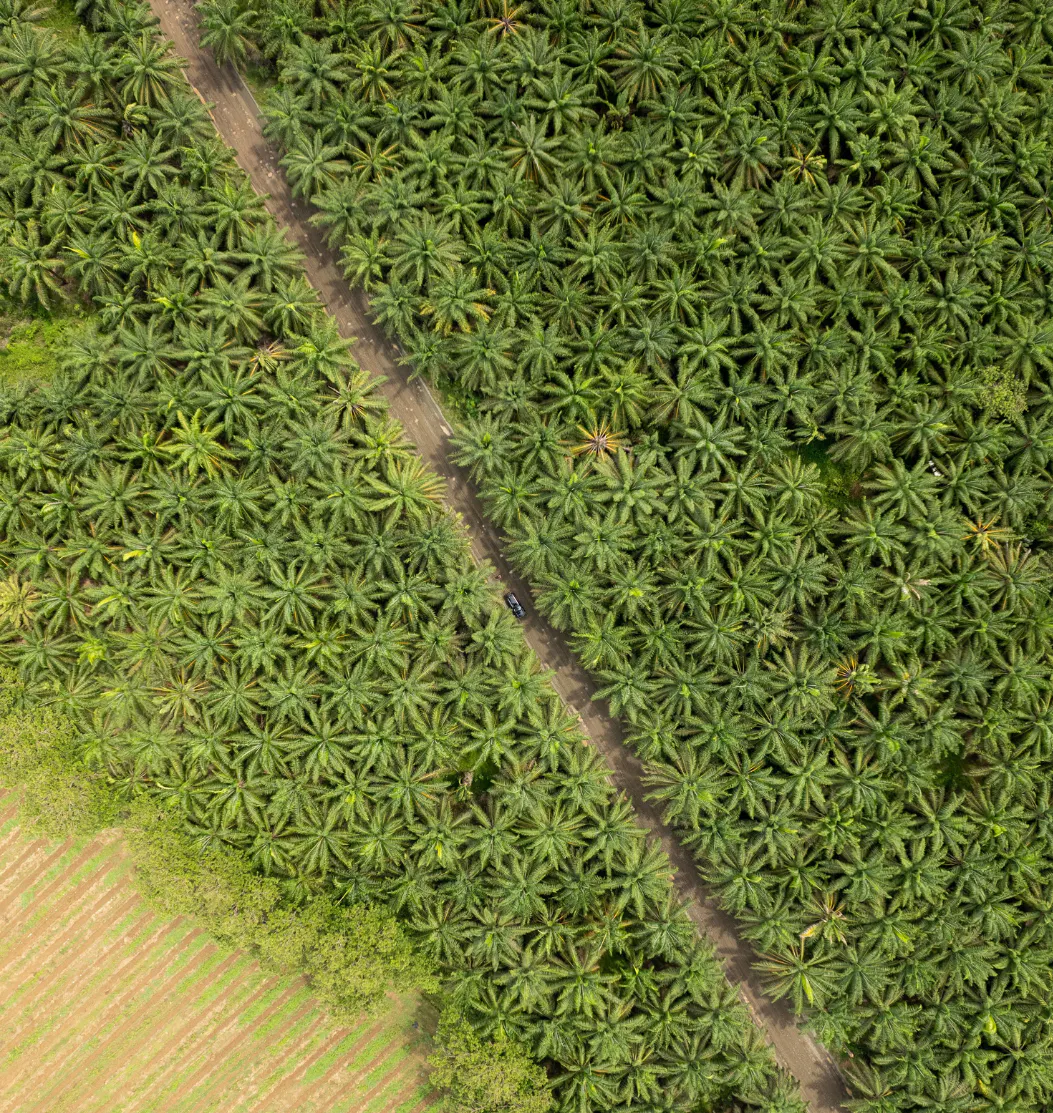
Months of screening work delivered in minutes. Access 25 years of biomass and carbon trend data for any area of interest, from individual plots to entire jurisdictions.
Compare projects on a like-for-like basis, from individual plots to large site sets. The same validated dataset, the same methodology, anywhere on Earth.
REDD+: assess historical degradation and deforestation. ARR: understand starting carbon stocks. IFM: track yearly biomass change and accumulation rates.
Track performance, manage portfolios, and deliver credible insights that support confident decision-making across multiple forest sites. All in the Chloris Platform.
what you track
STOCK- Total biomass and average density, with uncertainty ranges.
CHANGE - Annual gain or loss, and cumulative change since 2000.
ALERTS - Biomass at Risk flags potential loss events monthly.

30m and 10m resolution data across every site in your portfolio. Track biomass trends, growth curves, and annual carbon performance, consistently and at scale.
Group sites by collection, country, or investment portfolio. Aggregate stats across thousands of polygons, from individual agroforestry plots to large investment portfolios, in one place.
Biomass at Risk delivers near-real-time monthly alerts on potential loss events before they become material, giving investors and buyers the defensible, transparent data they increasingly require.
From establishing a credible baseline to generating MRV-ready outputs, Chloris gives project developers across REDD+, IFM, and ARR the data and documentation to move faster, reduce costs, and satisfy auditors.
methodology SUPPORT
VM0047 — Verra
Gold Standard ARR
ACR 2.1
REDD+ (VM0015, VM0007)
IFM

An annual biomass record since 2000 lets you establish credible baselines for REDD+, IFM, and ARR projects across any geography. The same consistent, validated dataset works from individual project boundaries to entire jurisdictions, without the cost and overhead of internal data analysis teams.
Direct biomass measurement captures gradual carbon loss that land cover classification misses entirely. Separate degradation from natural disturbance events like fire cycles, so your MRV reports reflect the true carbon impact and your credit volumes hold up under scrutiny.
Every estimate is delivered with quantified uncertainty, full methodology documentation, and a transparent audit trail from satellite source data to final figure. Data that satisfies verification bodies without rework, with expert support available when auditors ask technical questions.
You collect supplier locations and define spatial boundaries for one or two priority commodities.
You collect supplier locations and define spatial boundaries for one or two priority commodities.
Chloris quantifies land use change emissions and removals across those locations.
Chloris quantifies land use change emissions and removals across those locations.
Outputs are aligned with GHG Protocol and SBTi requirements, delivered FLAG-ready.
Outputs are aligned with GHG Protocol and SBTi requirements, delivered FLAG-ready.
You integrate the outputs into your annual GHG inventory, then scale to the full supplier base.
You integrate the outputs into your annual GHG inventory, then scale to the full supplier base.
Explore global biomass for free, or talk to us about data for your own sites.


